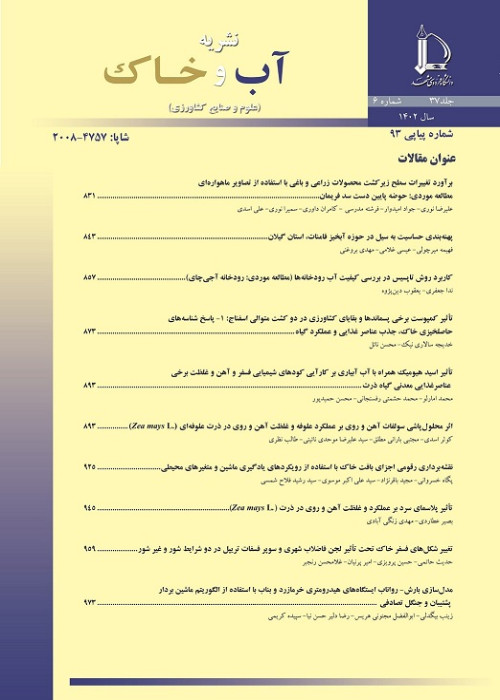
Comparative Study of Regional Estimation Methods for Daily Maximum Temperature (A Case Study of the Isfahan Province)
Author(s):
Abstract:
Introduction
As the statistical time series are in short period and the meteorological station are not distributed well in mountainous area determining of climatic criteria are complex. Therefore, in recent years interpolation methods for establishment of continuous climatic data have been considered. Continuous daily maximum temperature data are a key factor for climate-crop modeling which is fundamental for water resources management, drought, and optimal use from climatic potentials of different regions. The main objective of this study is to evaluate different interpolation methods for estimation of regional maximum temperature in the Isfahan province. Materials And Methods
Isfahan province has about 937,105 square kilometers, between 30 degree and 43 minutes to 34 degree and 27 minutes North latitude equator line and 49 degree and 36 minutes to 55 degree and 31 minutes east longitude Greenwich. It is located in the center of Iran and it's western part extend to eastern footage of the Zagros mountain range. It should be mentioned that elevation range of meteorological stations are between 845 to 2490 in the study area. This study was done using daily maximum temperature data of 1992 and 2007 years of synoptic and climatology stations of I.R. of Iran meteorological organization (IRIMO). In order to interpolate temperature data, two years including 1992 and 2007 with different number of meteorological stations have been selected the temperature data of thirty meteorological stations (17 synoptic and 13 climatologically stations) for 1992 year and fifty four meteorological stations (31 synoptic and 23 climatologically stations) for 2007 year were used from Isfahan province and neighboring provinces. In order to regionalize the point data of daily maximum temperature, the interpolation methods, including inverse distance weighted (IDW), Kriging, Co-Kriging, Kriging-Regression, multiple regression and Spline were used. Therefore, for this allocated data (24 days for each year and 2 days for each month) were used for different interpolation methods. Using difference measures viz. Root Mean Square Error (RMSE), Mean Bias Error (MBE), Mean Absolute Error (MAE) and Correlation Coefficient (r), the performance and accuracy of each model were tested to select the best method. Results And Discussion
The assessment of normalizing condition of data was done using Kolmogrov-Smirnov test at ninety five percent (95%) level of significance in Mini Tab software. The results show that distribution of daily maximum temperature data had no significant difference with normal distribution for both years. Weighed inverse distance method used for estimation daily maximum temperature, for this purpose, root mean square error (RMSE) for different status of power (1 to 5) and number of station (5,10,15 and20) was calculated. According to the minimum RMSE, power for 2 and number of station for 15 in 2007 and power for 1 and number of station for 5 in 1992 were obtained as optimum power and number of station. The results also show that in regression equation the correlation coefficient were more than 0.8 for the most of the days. The regression coefficient of elevation (h) and latitude (y) were almost negative for all the month and the regression coefficient of longitude (x) was positive, showing that decreasing temperature with increasing elevation and increasing temperature with increasing longitude. The results revealed that for Kriging method the Gussian model had the best semivariogram and after that spherical and exponential were in the next order, respectively for 2007 year. In the year 1992, spherical and Gussian models had better semivariogram among others. Elevation was the best variable to improve Co-kriging method as auxiliary data. such that The correlation coefficient between temperature and elevation was more than 0.5 for all days. The results also show that for Co-Kriging method the spherical model had the best semivariogram and after that the exponential and Gussian were in the next order, respectively for 2007 year. In the year 1992, the best model of semivariogram was the linear model and after that the spherical and Gussian models had better semivariogram in the next order. Conclusion
The results revealed that the application of multiple regression method for interpolation produced less errors between observed and estimated maximum temperature in 1992 (RMSE ranges from 1.41 to 4.03, MAE ranges from 0.98 to 2.55, and r ranges from 0.61 to 0.95). For 2007 year, the best estimation was performed by multiple regression and Kriging-Regression (RMSE=ranges from 0.99 to 3.98, MAE ranges from0.77 to 2.92, and r ranges from 0.32 to 0.97). Kriging, Co-Kriging, IDW, Spline methods were also reasonably performed well and could be used as the second order of priority. In addition, with increasing number of stations in 2007 as compared to 1992, the overall accuracy of model performance in estimation of daily maximum temperature have been improved.Keywords:
Language:
Persian
Published:
Journal of water and soil, Volume:29 Issue: 2, 2015
Pages:
504 to 516
magiran.com/p1450241
دانلود و مطالعه متن این مقاله با یکی از روشهای زیر امکان پذیر است:
اشتراک شخصی
با عضویت و پرداخت آنلاین حق اشتراک یکساله به مبلغ 1,390,000ريال میتوانید 70 عنوان مطلب دانلود کنید!
اشتراک سازمانی
به کتابخانه دانشگاه یا محل کار خود پیشنهاد کنید تا اشتراک سازمانی این پایگاه را برای دسترسی نامحدود همه کاربران به متن مطالب تهیه نمایند!
توجه!
- حق عضویت دریافتی صرف حمایت از نشریات عضو و نگهداری، تکمیل و توسعه مگیران میشود.
- پرداخت حق اشتراک و دانلود مقالات اجازه بازنشر آن در سایر رسانههای چاپی و دیجیتال را به کاربر نمیدهد.
In order to view content subscription is required
Personal subscription
Subscribe magiran.com for 70 € euros via PayPal and download 70 articles during a year.
Organization subscription
Please contact us to subscribe your university or library for unlimited access!


